
You asked and we listened! We’re excited to launch our client profile pages and analytics for all our TinEye APIs. You can use the API analytics page to check:
- your search usage: this is the total number of searches you have completed using the API
- and your image collection size: which is the total number of images you uploaded via the API.
You’ll also find a summary there of your charges and billing details.
To check out your new profile pages, just login into your TinEye Services account. Once logged in you can access your profile, analytics and billing pages. The analytics page allows you to explore your usage of the API and view performance data.
TinEye API Analytics
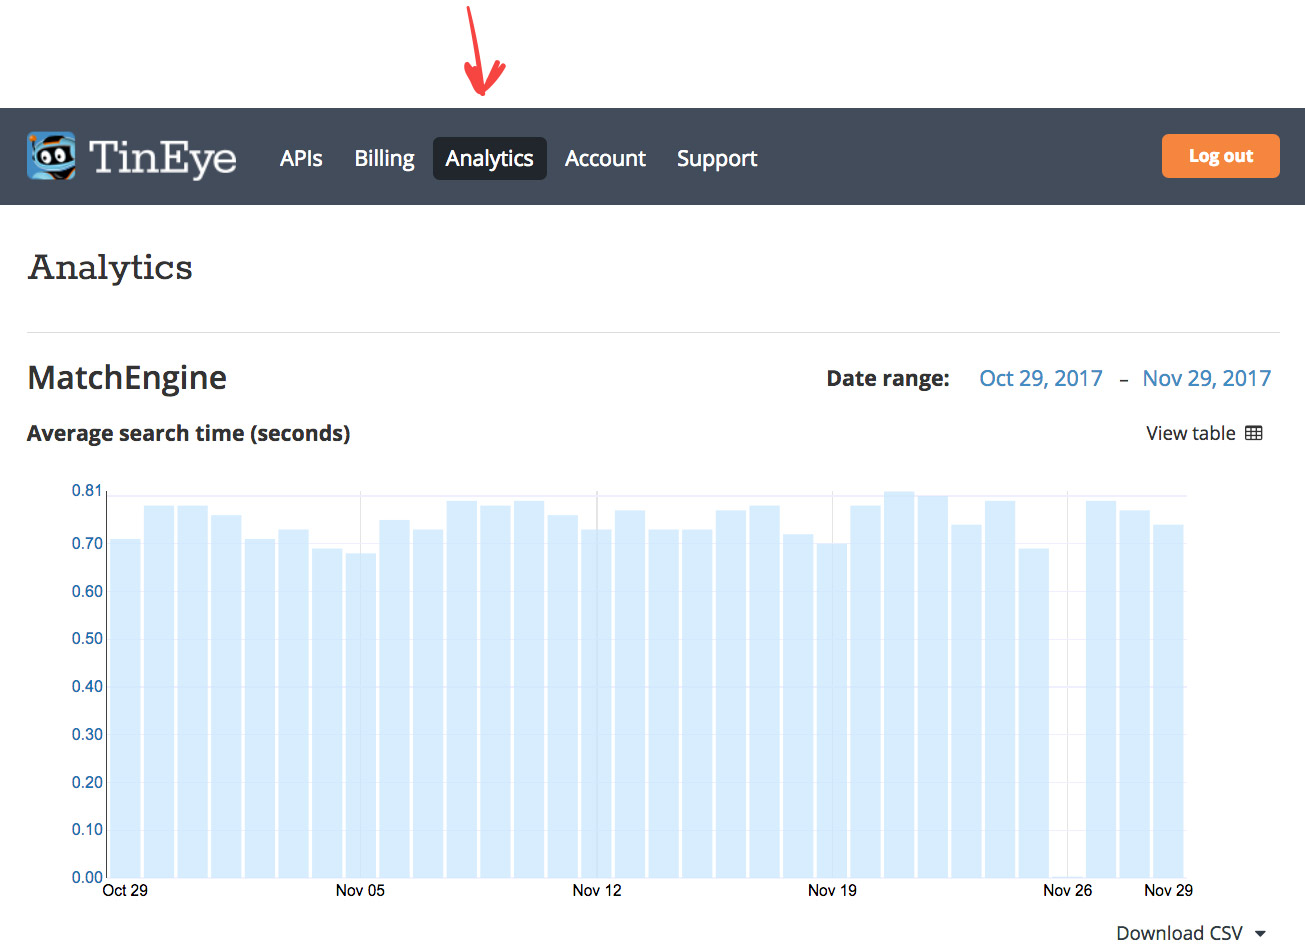
Average search time tracks the daily performance of our API. Generally you should see consistent performance unless you dramatically increase the size of your image collection. If you have any questions about performance just get in touch, we’ll be happy to help. One tip to keep your searches fast is to avoid using slower hosts when providing query files via URL.
The Searches and Images section displays the number of searches you’re running, broken down by day, and the size of your collection.
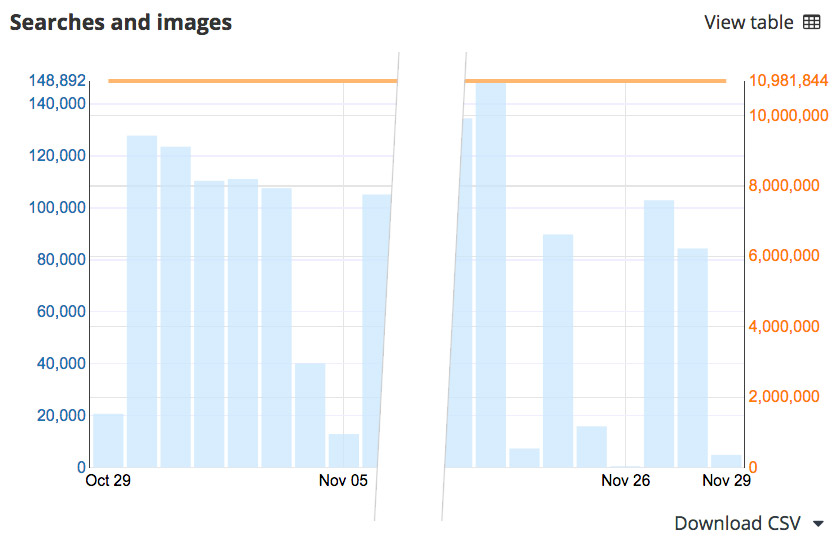
Each chart can be viewed as a table if you prefer. You can also download the data as a CSV to analyze or store it offline.
We hope this new capability helps you better manage and understand your API use. Again, you are always free to get in touch if you have any questions or suggestions.